Helping you have fun on the Chattahoochee River!
Swim Guide
Is it safe to swim here? This is a question we often get at Chattahoochee Riverkeeper. Through our Neighborhood Water Watch program, we monitor water quality at over 300 stream, river, and lake sites each week throughout the year and publish the data on our in-house Neighborhood Water Watch database. This year, we are excited to provide Swim Guide – a series of maps with red or green lights to help you decide if it is safe for primary contact recreation at popular swimming spots on the Chattahoochee River.
How it works: Each Thursday from Memorial to Labor Day, our staff, interns, and volunteers collect and analyze water samples at popular recreation sites for E. coli bacteria. On Friday, we will publish a series of maps on our social media channels and the Swim Guide website. The data is also published on our Neighborhood Water Watch database.
The goal: We want you to be knowledgeable about water quality conditions and have fun on the Chattahoochee River!
Summer 2025 Swim Guide Sites
- Lake Lanier
- Metro Atlanta (Chattahoochee River National Recreation Area)
- West Point Lake
- Columbus
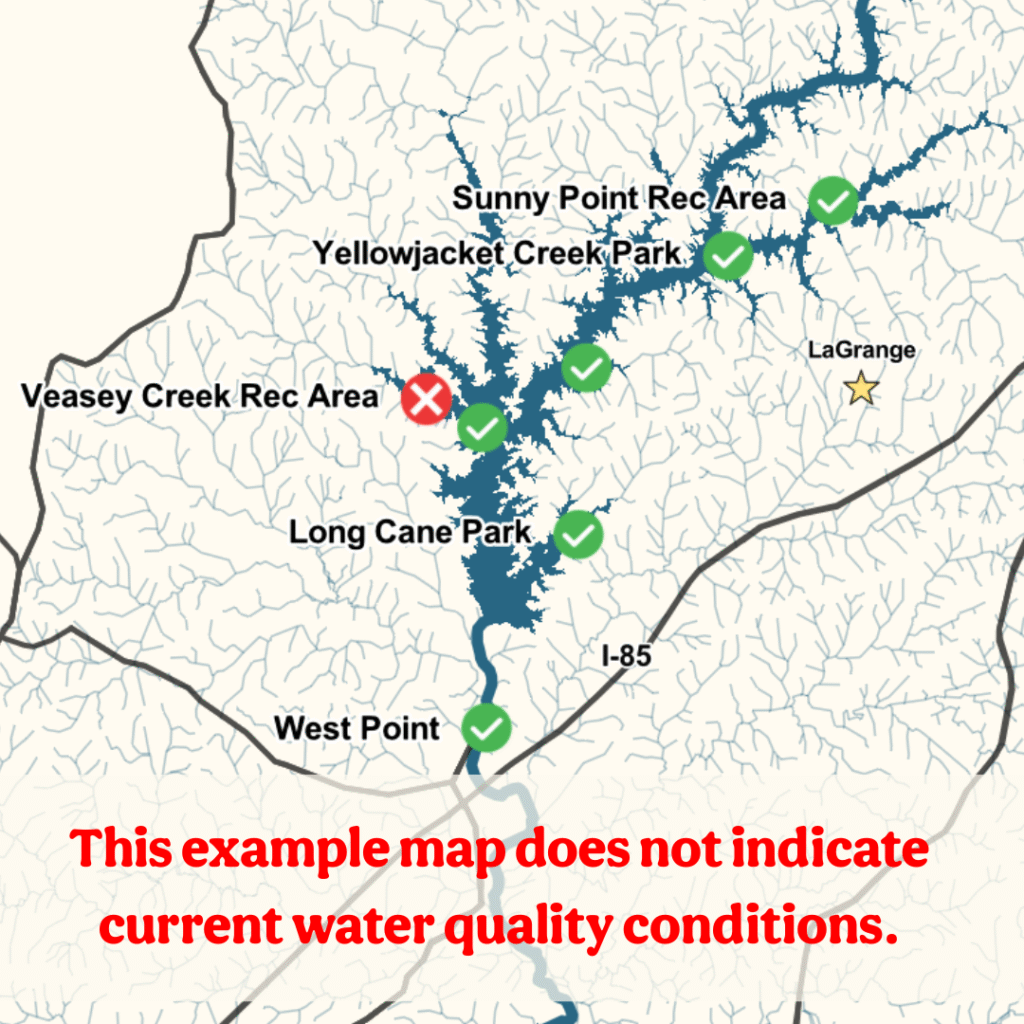
What do the symbols mean?
Red X: High Risk – E. coli is greater than 235 MPN/100 mL
Green Checkmark: Low Risk – E. coli is less than 235 MPN/100mL
Risk levels are based on EPA Beach Action Value information. Note that samples are only collected once a week and water quality conditions can change quickly. If it has rained in the last 48 hours, if the river is high and muddy, or if the lake has a bright green color, we highly recommend using caution when having physical contact with the water.
Don’t see your site or want to see the actual bacteria concentration? Check out our Neighborhood Water Watch database! We sample at hundreds of sites each week throughout the year.
Frequently Asked Questions
Click the drop-down items below for more information about E. coli monitoring.
What is E. coli?
Escherichia coli (E. coli) is an indicator bacteria that is commonly found in the gastrointestinal tract and feces of warm-blooded animals and humans. According to the U.S. Environmental Protection Agency, E. coli is the best indicator of the presence of pathogens in surface waters and its presence provides direct evidence of fecal contamination of the water.
How are the E. coli results interpreted to determine if they are acceptable?
The U.S. EPA has developed Beach Action Value (BAV) criteria for fecal indicator bacteria, above which indicate potentially unsafe conditions for primary contact recreation such as swimming and tubing. The BAV criteria for E. coli concentrations in fresh water is 235 colony forming units per 100 mL of water, representing a gastrointestinal illness risk-level of 36 people per 1,000 primary contact recreators. The EPA recommendations were developed for the general population including children and have not been evaluated for persons over 55 years of age, pregnant women, or other vulnerable individuals such as those that are immune compromised.
Other factors that determine if a person will become sick:
- how long someone is in contact with the water
- if water comes into contact with a person’s mouth or eyes
- if the person has any skin abrasions that will allow water to enter the body
- the age and health of the person as that can determine a person’s susceptibility to illness
It is important to note that these indicators represent an increased potential to contract illness. The public should use this information and other available data to guide their decisions about use of the Chattahoochee River.
How do waters become contaminated?
Many of the rivers, streams, and lakes throughout the Chattahoochee watershed are vulnerable to increased bacterial contamination especially during heavy rains which can convey bacteria from various sources to waterways. Common sources of bacteria and other pollutants include cracked and overflowing and leaking septic systems, cracked and clogged sewer infrastructure, agriculture, wildlife, and pet waste.
What makes bacteria levels go up and down?
Levels of bacteria in a river or stream can be influenced by many factors. The most common causes for elevated levels of bacteria are due to runoff associated with storms; however, leaking sewage lines or spills from treatment plants can also cause levels to increase. E. coli concentrations are typically higher (1) during and after rain events, (2) on tributary streams than in the main stem Chattahoochee River, (3) during the summer season than during the winter months, and (4) at night rather than during daylight hours.
How is E. coli measured?
There are several ways of measuring numbers of E. coli bacteria in streams. The method used to determine the numbers reported on CRK’s website involves a relatively new method recently approved by the EPA called the IDEXX Colilert-18 system. It involves the collection of water from a stream or river using sterile equipment and adding a chemical called MUG. This mixture is then poured into a container that separates the sample water into equal-sized compartments. The container is sealed and incubated for 18-22 hours. The sample water in the compartments containing coliform bacteria and E. coli will change color. The number of compartments which turn yellow indicates the most probable number (MPN, which is a similar value to CFU) of total coliform bacteria in the stream while the number compartments which fluoresce under ultraviolet light indicates the number of E. coli present in the stream at the time that it was sampled.
What is an indicator organism and why do we measure indicators instead of pathogens?
A microbial indicator organism is a single celled organism that is usually harmless, found in high numbers, and originates from the same sources as the pathogens whose numbers you are interested in obtaining. Monitoring for indicator organisms is usually much easier and more cost effective than monitoring for the disease-causing organisms. Pathogens are disease-causing organisms such as some types of bacteria, viruses, and protozoans and typically occur in very small concentrations, so routinely monitoring for these pathogens is comparable to looking for a needle in a haystack. Field sampling and laboratory methods for measuring pathogens are very time consuming, expensive, and sometimes put the analyst at more risk for being infected by the pathogen.
Support Swim Guide!
Help sustain this vital water monitoring program with a donation.